 Optimal Offshore
Service 06 · Reporting
Outsourced data analysis and reporting for faster operational decisions.
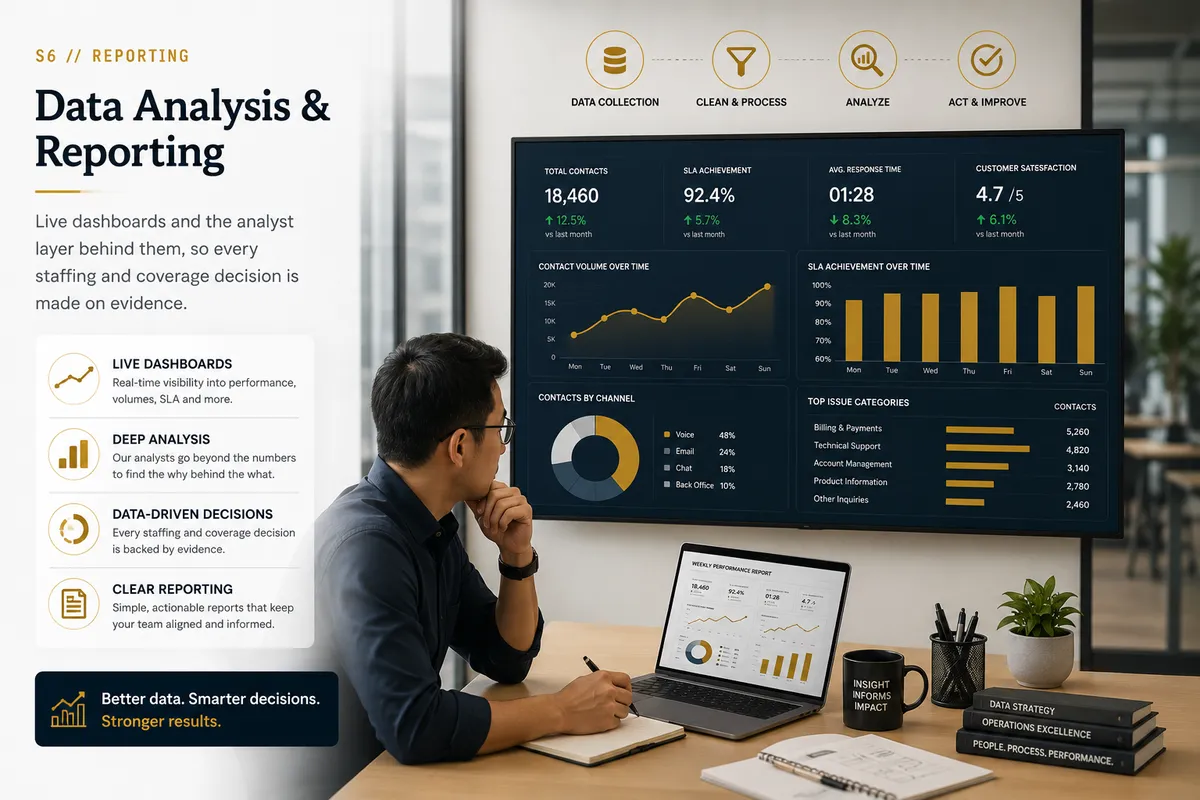
Live dashboards and the analyst layer behind them — so every staffing and coverage decision is made on evidence, not memory.
01 ▸ The problem
By the time the deck is built, the moment is gone.
Most operations reporting is archaeology: numbers assembled at month-end to explain what already happened, in a format nobody can drill into.
Worse, nobody validates it. A broken formula or a stale extract quietly steers real decisions — and no one finds out until the numbers stop adding up.
02 ▸ Why it breaks
Five ways reporting fails the people who rely on it.
Month-end archaeology.
Reports that explain the past instead of steering the present.
Unvalidated numbers.
No data validation step — so errors ship with the same confidence as facts.
Metric soup.
Fifty KPIs, no definitions, and three versions of the same number in one meeting.
No analyst layer.
Dashboards without anyone accountable for explaining why the line moved.
Manual and fragile.
One person's spreadsheet holds the whole reporting stack together.
You don't need more reports.You need numbers you can act on, while they still matter.
Defined metrics, validated pipelines, live dashboards — and analysts accountable for the 'why' behind every movement.
No black box · Operator-owned
03 ▸ How we do it
From source to decision, governed.
Four phases from raw data to a reporting operation you can trust.
Baseline
Audit sources and definitions. Every metric gets a written definition and one owner — so one number means one thing.
Build
Live dashboards on your KPIs with validation built into the pipeline — 100% of deliverables pass a documented check before anyone sees them.
Analyze
The analyst layer: variance commentary, driver analysis and recommendations — insight actionability is a scored dimension, not a bonus.
Govern
Version control, methodology documentation, automation coverage — and a defect-free rate tracked like any other SLA.
BenchmarkScored on our Service Delivery Excellence Framework — fabricated or unvalidated data is a critical error that fails the month outright.
04 ▸ What you get
A reporting operation, not a deck factory.
Live, not lagging
Dashboards that show today — month-end becomes a review, not a revelation.
Validated by process
Every deliverable passes documented validation before it ships.
One version of truth
Defined metrics with owners — no more three versions of the same number.
Insight with the numbers
Analysts explain why the line moved and what to do about it.
Automation that compounds
Manual steps retired systematically — coverage tracked as a metric.
05 ▸ Held to the number
The numbers behind the numbers.
Reporting is a service line — it gets a scorecard too.
Deliverables right the first time, measured per cycle.
Reporting SLAs hit like any other SLA.
No deliverable ships without its documented check. Ever.
Scored on whether analysis actually drives decisions.
GovernanceRed-amber-green, in the open, every day. No black box.
06 ▸ Related services